I’m wanting knowledge on as many different kinds of data visualization software as possible, and the latest one I’ve started working with is Tableau Public.
However, for this particular software, I’m working on it at home instead of on the work computer, because Tableau only works with Windows and not MacOS. Then there’s the question of how much I would actually be able to use it with work projects, since the data visualizations are in JavaScript and our CMS will only play with Flash codes being plugged into the HTML editor. (the same reason I haven’t been able to use Google Gadgets for quick-and-dirty charts.)
But I’m still excited. I like Tableau’s potential for using rawer, itemized data sets as comparable to the other data visualization tools I’ve used. It does all the summarizing for you.
Plus, it’s big on highlighting specific data on request. Go ahead, click on just about anything down there, and it highlights specific information for you. Pretty handy if the data sets start getting complex.
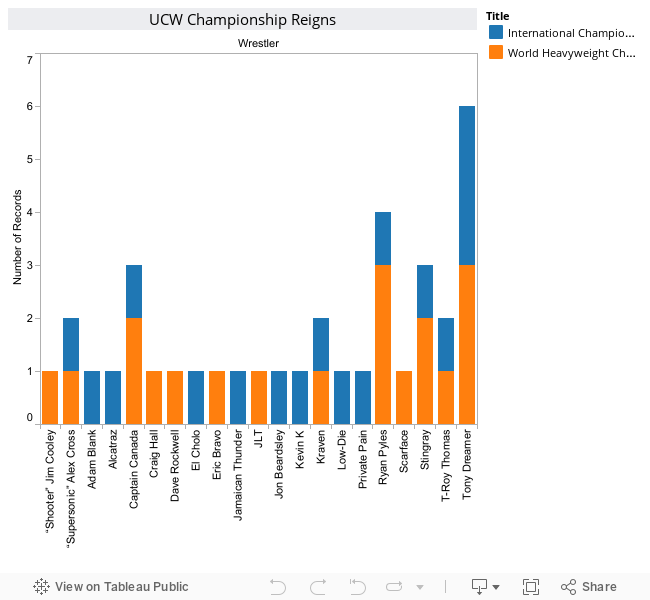
So, here’s my first simple Tableau data visualization. It’s based off of Ultimate Championship Wrestling, a ministry I’m involved with at my church here in Yuba City. Yes, go ahead and laugh, I’m a pro wrestling mark and I don’t care.
I compiled a list of every individual title reign for the two championships UCW uses, and then built this graph to where you can see how many times each individual wrestler has won each title.
It’s real basic, but it’s a start and is really just scratching the surface of what Tableau is capable of.
Oh, and if you’re interested, UCW’s March Madness XIII is at 7 p.m. on March 11 at Calvary Christian Center in Yuba City.
For fun, I downloaded your workbook, and made another viewpoint of the same data:
http://public.tableausoftware.com/views/ucw1edit/UCWChampionshipReignsEdit
I think this view displays the difference in the reign length and reign patterns between the two championships, and lets you clearly see who has reigned the longest.
If you look at it closely, you can see that there may be some data issues. Specifically around 3/1/2008, some reigns overlap, and one has a negative length.
Awesome, Joe. I’m working my way up to getting to do those timelines and viewpoints. I’ll try to replicate those, it’s a great place to start off of for my second 24 hours having the software.
And you’re right, there was a data issue. Here’s the cells to fix:
Change 17D to 07/2008-02/2009
Change 18D to 03/2009-03/2010 (NOTE: title was vacated for one month, just to explain the one-month gap))
Change 19D to 03/2010-07/2010
Change 20D to 07/2010-01/2011