Trying to see what else I can do quick and dirty-like with Tableau.
(And before I forget, Joe grabbed the UCW dataset and quickly showed me how much more I have to learn, and just how much more Tableau is capable of.)
I took home the spreadsheet built for the Appeal-Democrat’s Mid-Valley Unemployment Database (which is built on the site in Caspio) to see what other looks I could come up with in Tableau. Especially since the unemployment database, being organized by county, gives the potential for something to be done to create an interactive map, which I’ve been itching to do since I’ve been totally jealous of the stuff the Sacramento Bee has been doing with map-displayed databases but I haven’t had access to a copy of Flash and Illustrator to build on the basics I got while at KDMC in Berkeley.
Here’s the end result:
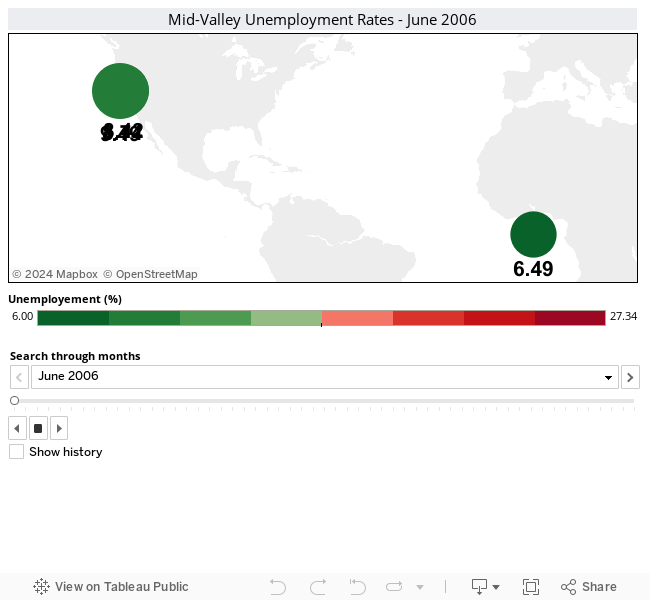
I selected only 3 1/2 years out of the 20-year data set, since this range best demonstrates just how much unemployment has spiked in the area. Also, I’m kind of bummed that the playback feature available on the desktop isn’t available once you share it publicly. Without looking on the Tableau forums and just assuming (*dramatic music*) Imagine it has to do with the loading speed from the public servers.
Probably tomorrow before work (night shift…some news to share on that later) I’ll start work on the multi-view dashboards like Joe made for the UCW data.